Hi Gang,
Over the past few months, we’ve had multiple requests from folks wanting direct integration with their current marketing & advertising campaigns, and we’re happy to announce that this is now possible:
A UTM code is a simple code that you can attach to a custom URL in order to track a source, medium, and campaign name. UTM codes are used Google Analytics, Mixpanel, Kissmetrics and most other analytics platform.
This means that you can now easily cross reference with your existing marketing & ad campaigns (or create new ones) to see which website, newsletter, or post your visitors are coming from!

We’re helping you to… Excel at tracking.
Now that I’m a Dad, I can make jokes like that. And now that you can track UTM codes, you’ll need some way to see them.
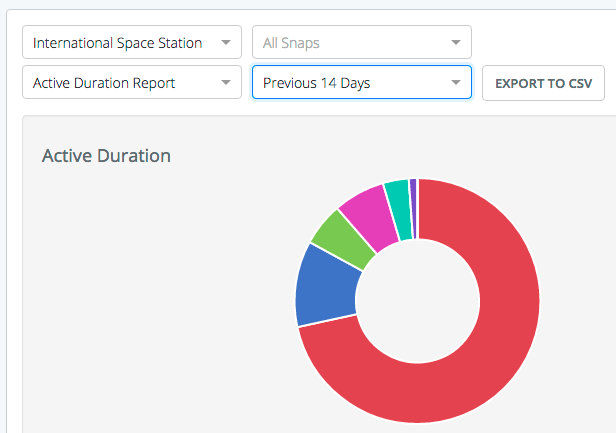
Our Plus & Premium members can now export all their reporting data in raw CSV format, perfect for importing into Excel or Numbers. Of course, this works even if you’re not using UTM codes. Get a granular view of who is returning, who clicked what, what ad campaign they came from, and more!
Each CSV report contains a unique Session ID per user, so you can reference individual users and their activity across all of your reports.

Group Activities!
We realize that reporting on every individual Snap was time consuming. So we’ve now added a powerful new Snap Group reporting feature, allowing you to run all reports on your Snap Groups. Snap Group reporting is now available to all subscription plans (even you freebees!) via a new Reporting button in your Dashboard.
This allows you to see all your Grouped Snaps reporting data at once, for your tours, campaigns, real estate properties, or whatever else you’re using Snap Groups for!

A/B Hotspot Testing.
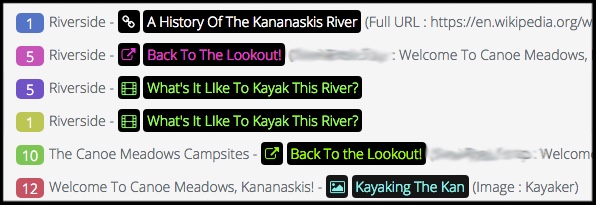
Last, but not least, is the inclusion of A/B Hotspot testing. When people click on your hotspots, the colors, icon, content, and description are saved. This means that if you change a Hotspot, and someone clicks on your updated one, you’ll see both the original, and updated one listed in your Hotspot Click report. This allows you to easily see if something like a simple color, or small text change can affect click rates.
The online report has also been updated to show you the name of the Snap that hotspot is in (for Snap Group reporting), as well as what the colors and icons were set to when the hotspot was clicked. Lots of testing to be done!
There are more updates on the way, and till next time, thanks so much for using our platform!
Leave a reply
You must be logged in to post a comment.